How to Find What's Causing CloudLinux Resource Limit Issues
When your hosting account hits a resource limit (CPU, memory, entry processes, etc.), CloudLinux automatically captures snapshots of what was happening at that moment. These snapshots help you identify exactly what caused the spike so you can fix the underlying issue.
What Is an Incident?
Section titled “What Is an Incident?”An incident is created when your account generates multiple resource limit faults within a short time period. If faults occur within 300 seconds (5 minutes) of each other, they are grouped into a single incident. Several snapshots are generated for each incident, giving you a complete picture of what your account was doing when it hit the limit.
Accessing Snapshots
Section titled “Accessing Snapshots”-
Log in to cPanel and navigate to Resource Usage (under the Metrics section).
-
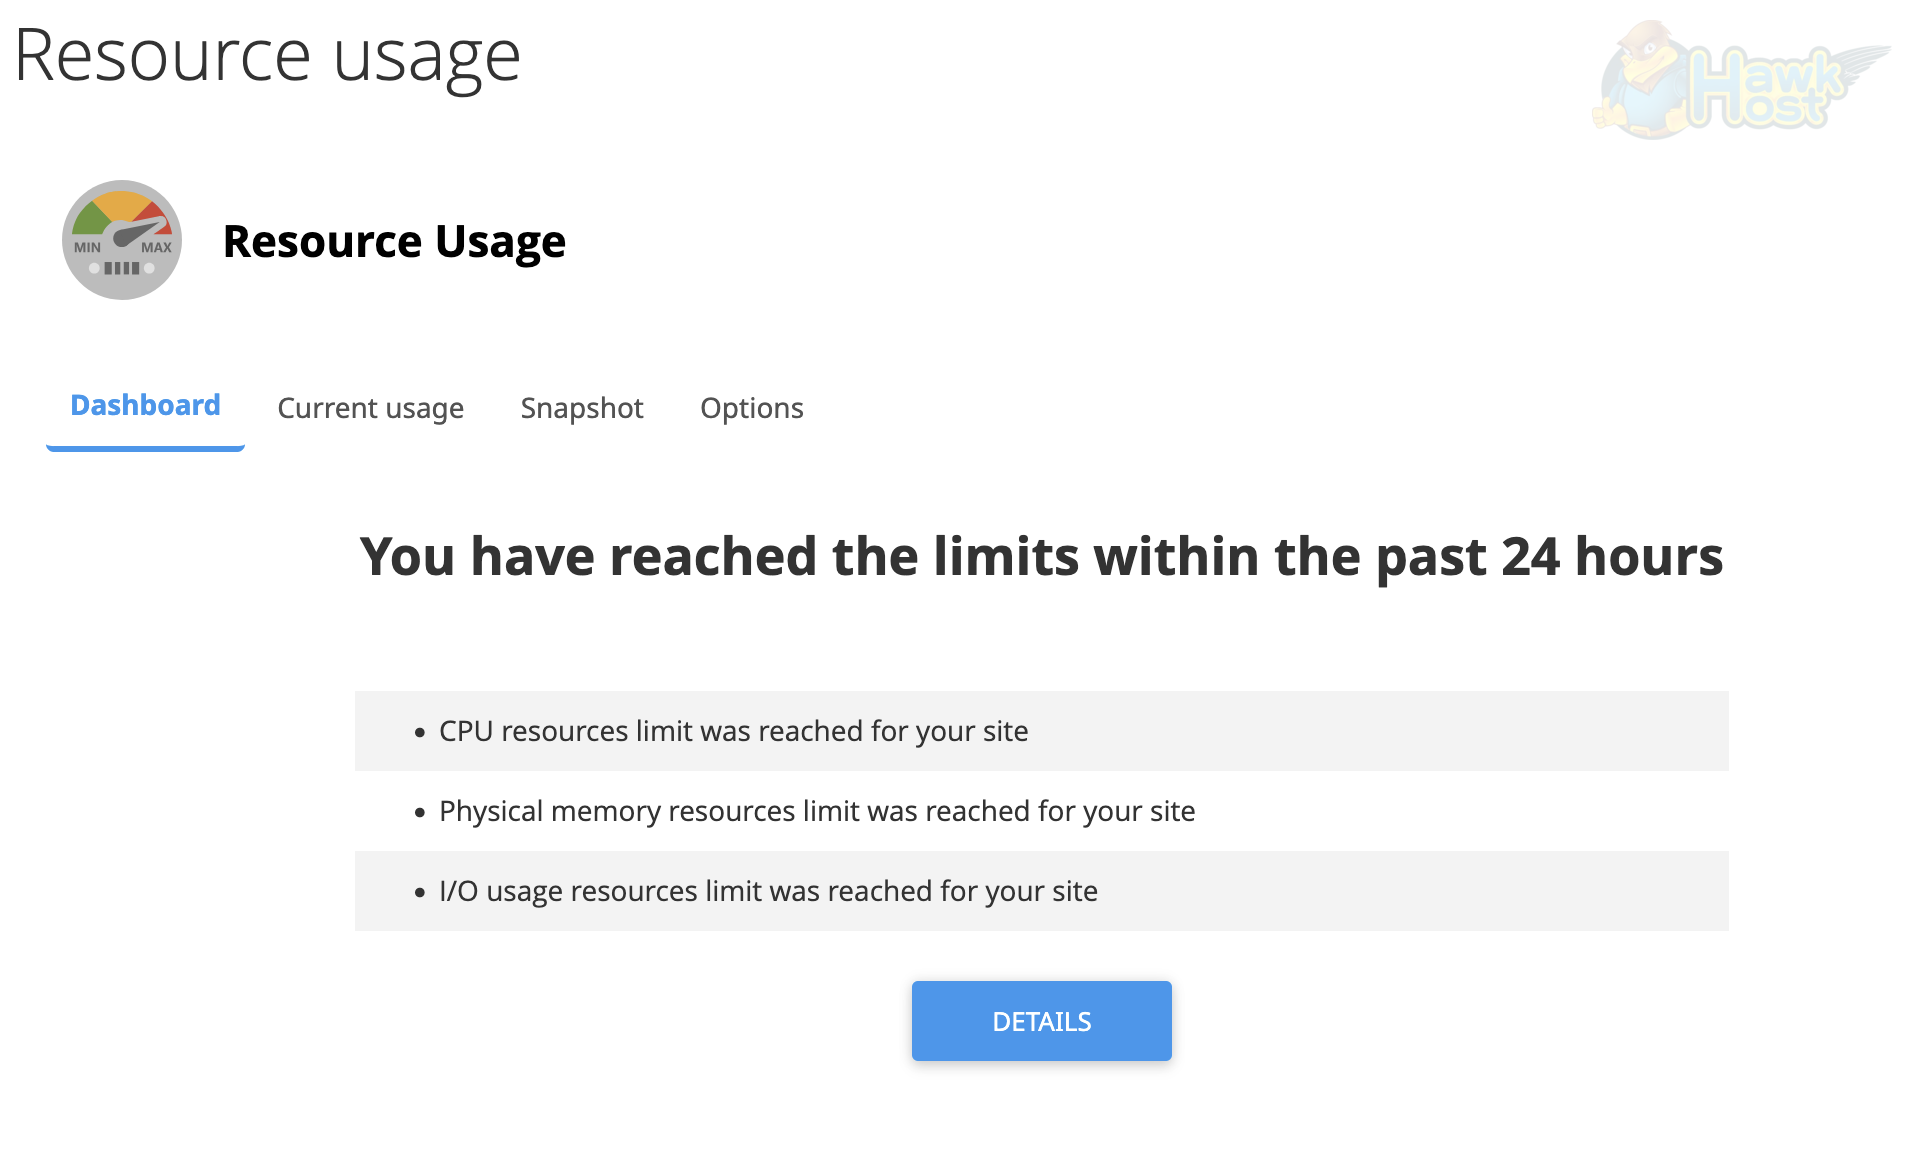
If your account has hit any limits in the past 24 hours, the Dashboard tab will show which limits were reached (CPU, memory, I/O, etc.) along with a Details button:
-
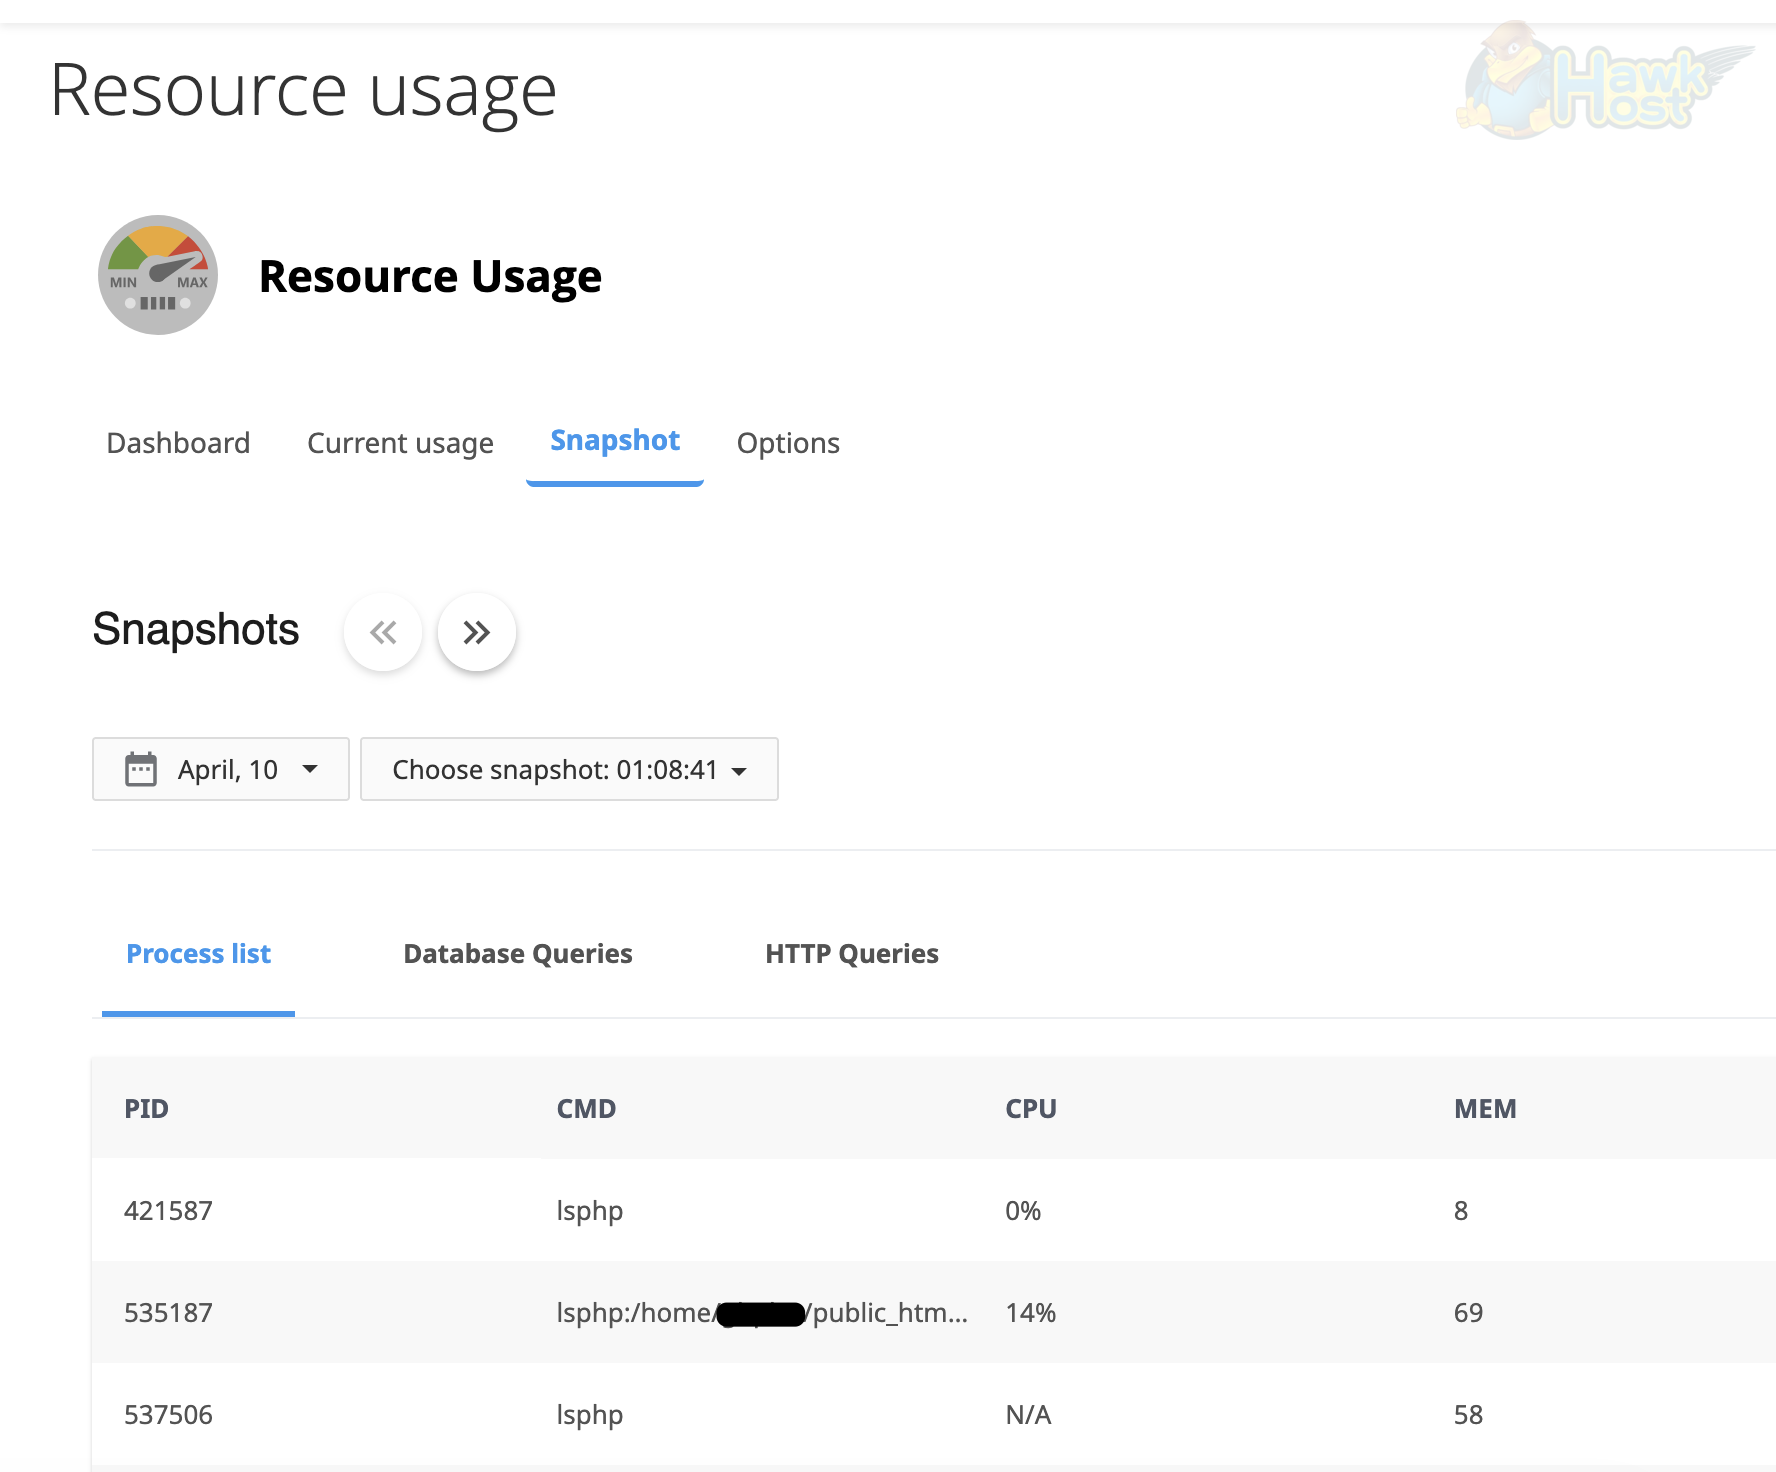
Click the Snapshot tab to view the captured snapshots. Use the date picker and the Choose snapshot dropdown to select the specific incident you want to investigate:
Snapshot Types
Section titled “Snapshot Types”Each snapshot contains three tabs: Process list, Database Queries, and HTTP Queries.
Process List
Section titled “Process List”The Process list tab shows all running processes on your account at the time of the incident. Each entry includes the PID (process ID), CMD (the command or script path), CPU usage percentage, and MEM (memory usage). This helps you spot:
- Long-running or stuck PHP (
lsphp) processes - Cron jobs consuming excessive resources
- Which specific scripts under your
public_htmlwere executing
HTTP Queries
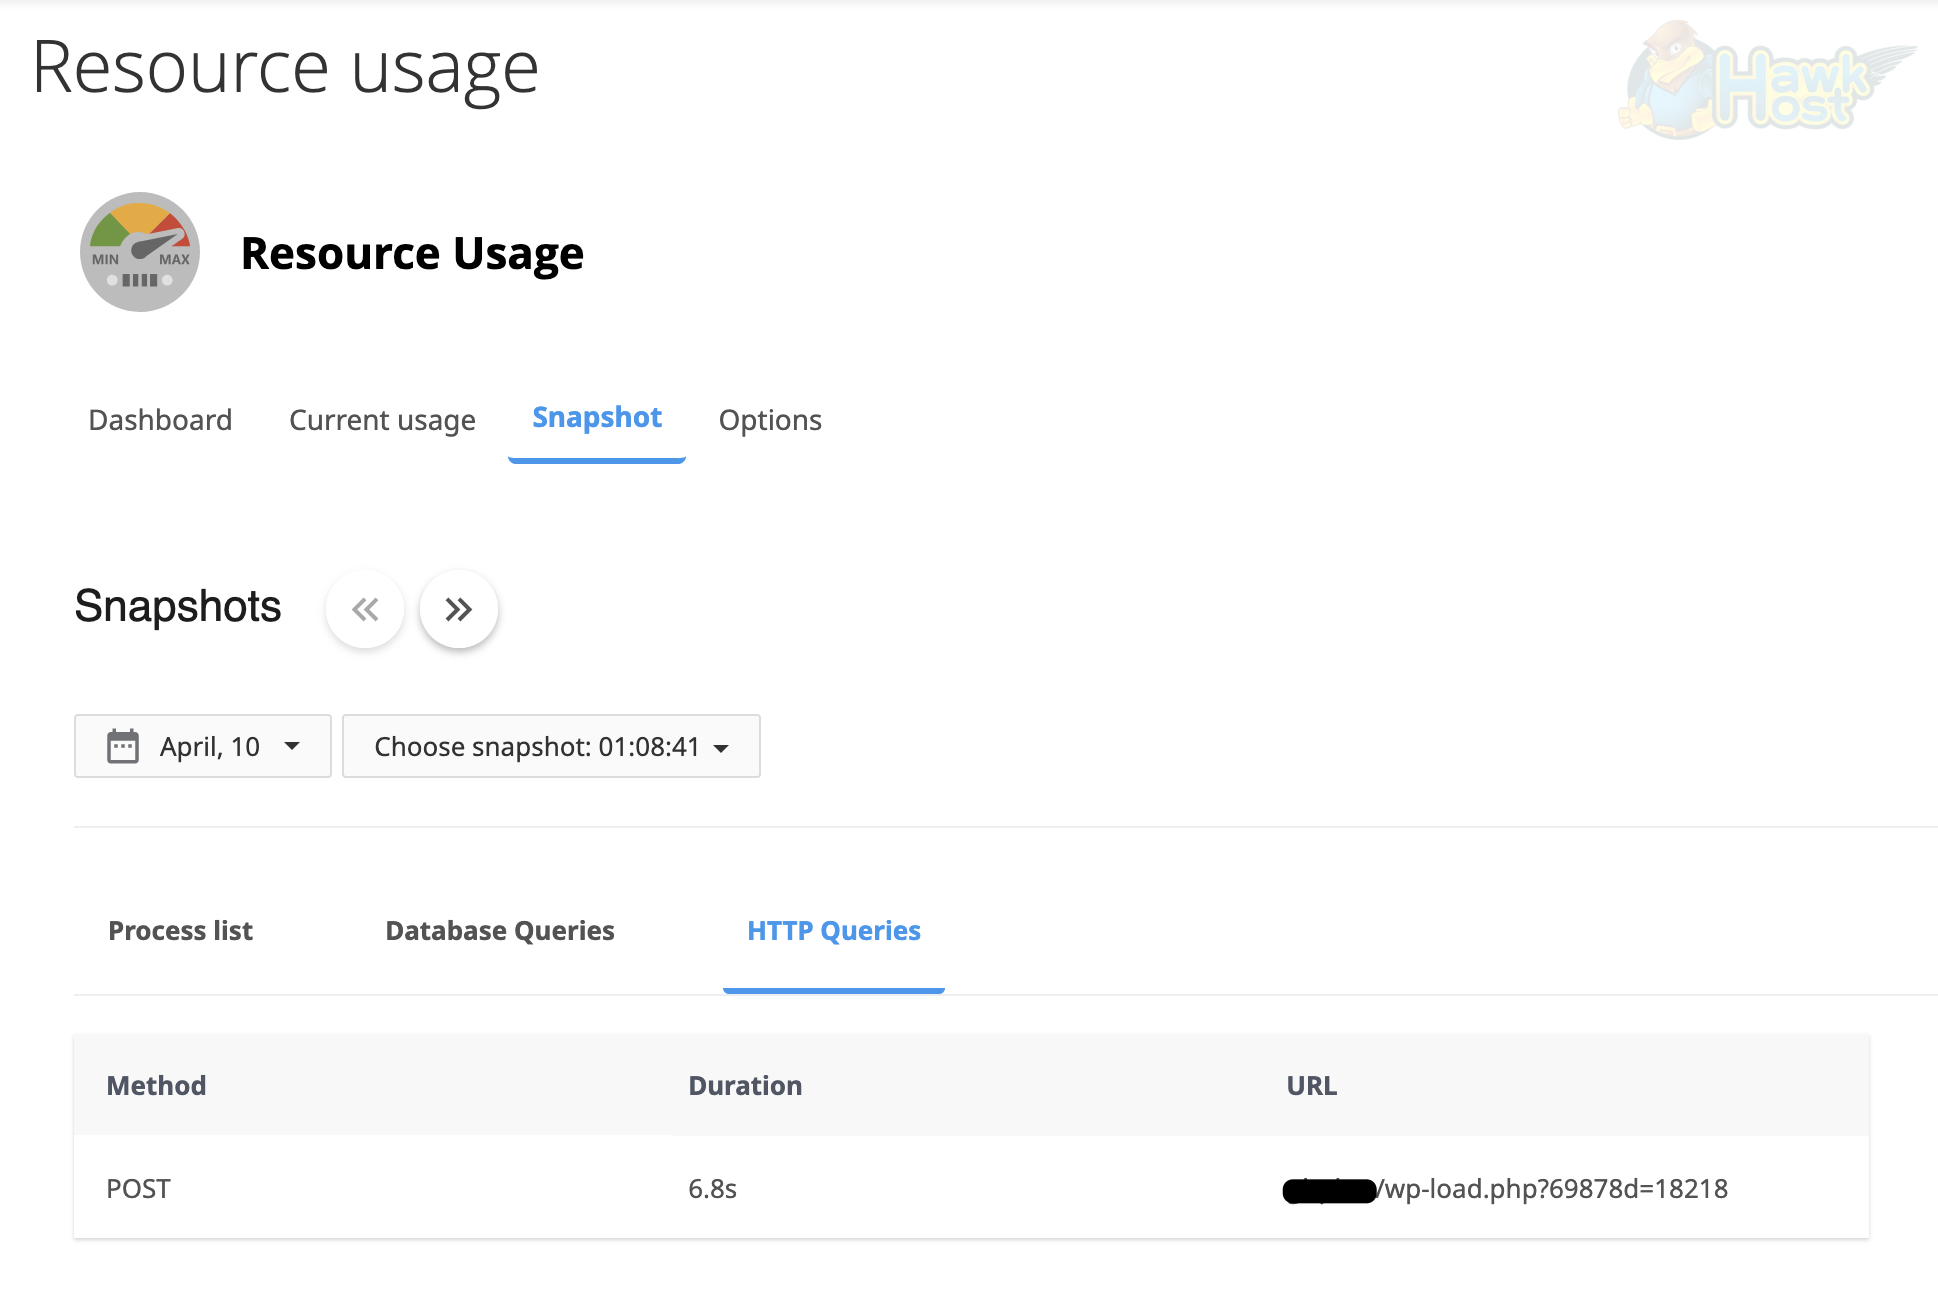
Section titled “HTTP Queries”The HTTP Queries tab captures the web requests being processed when the limit was reached. It shows the Method (GET, POST, etc.), Duration (how long the request took), and the URL being accessed:
This helps you identify:
- Slow requests (look for high Duration values)
- High-traffic pages or endpoints causing resource spikes
- Bots or crawlers generating excessive requests
- Specific PHP scripts (like
wp-load.phporwp-cron.php) consuming too many resources
Database Queries
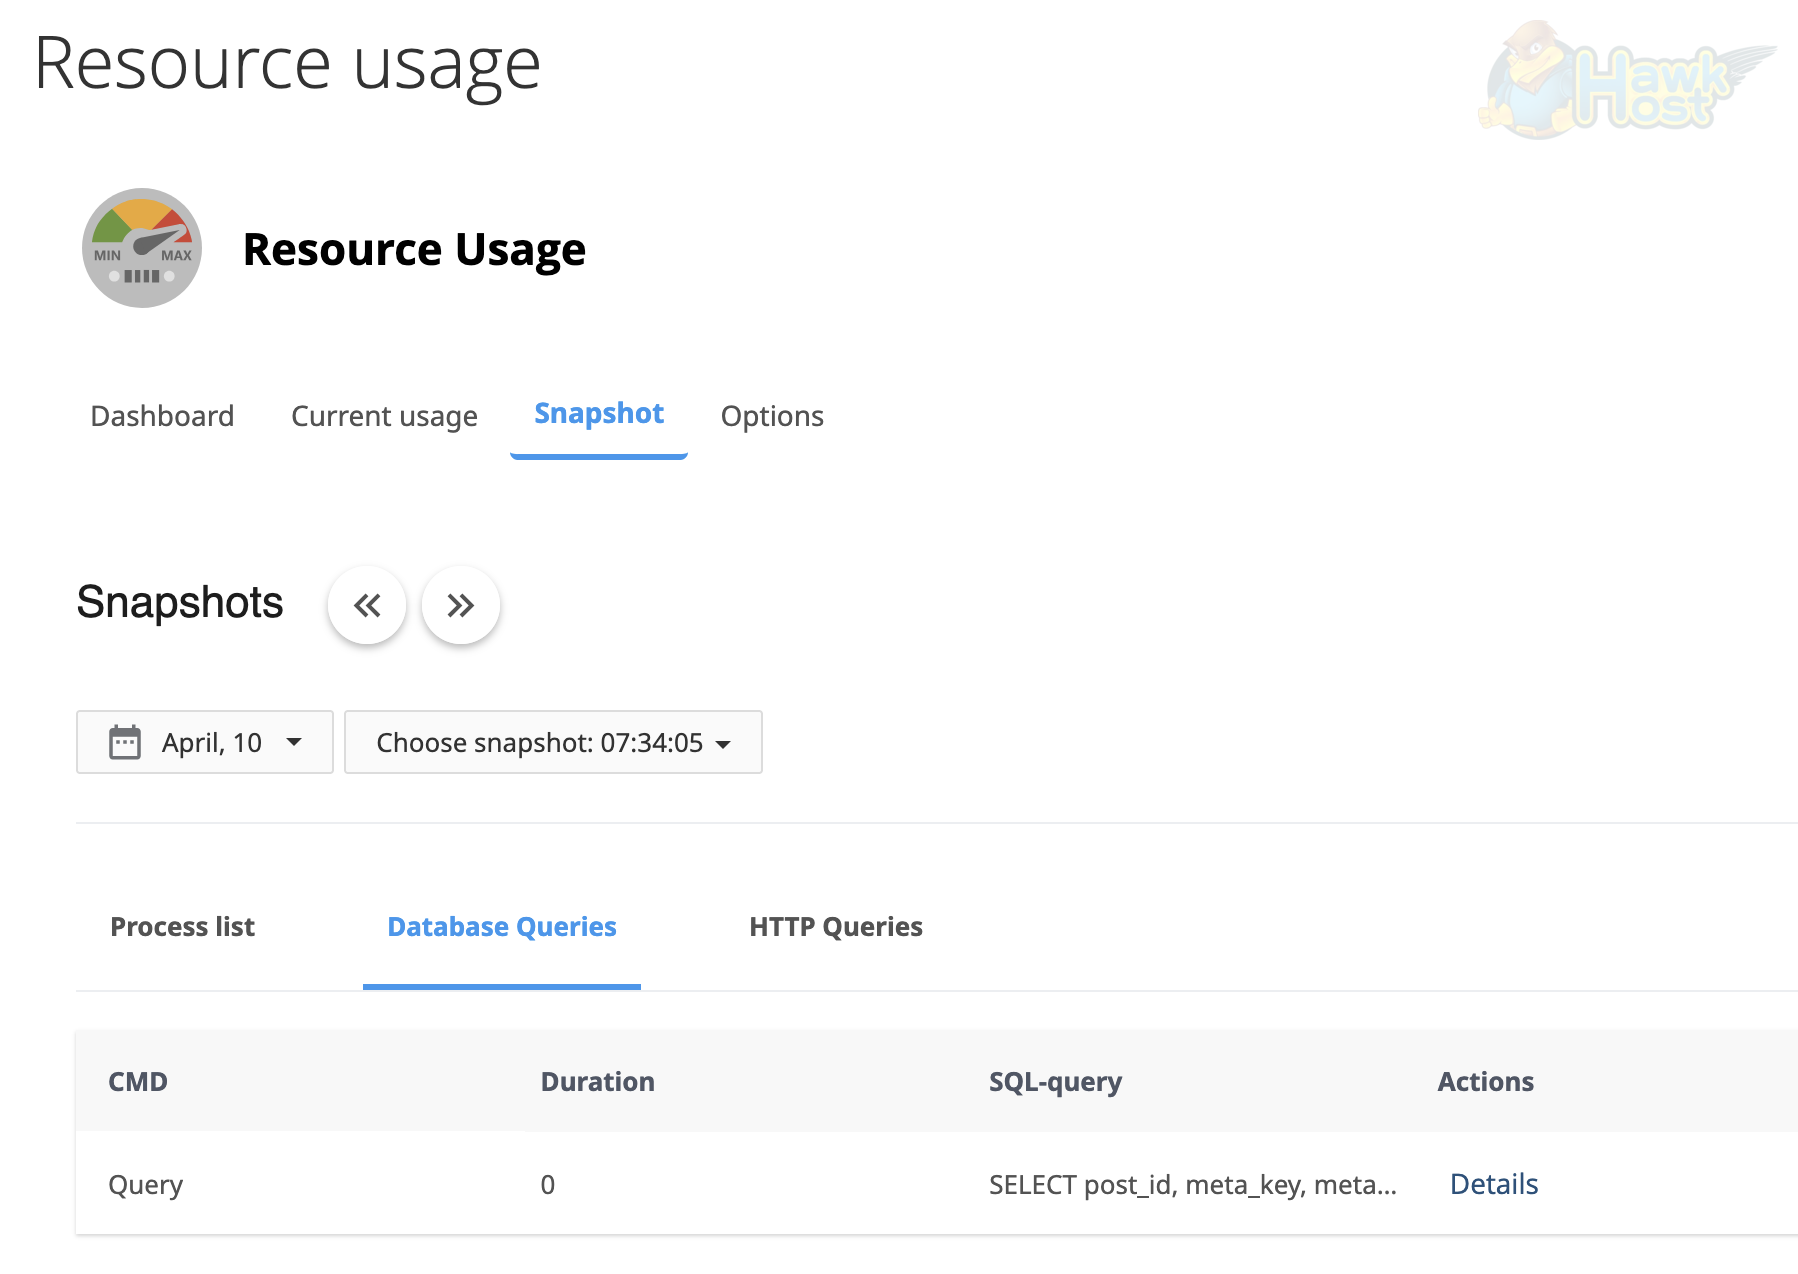
Section titled “Database Queries”The Database Queries tab captures active MySQL queries at the time of the incident. Each entry shows the CMD (command type), Duration (how long the query ran), and a truncated SQL-query preview. Click Details to view the full query text:
This helps you identify:
- Slow or unoptimized database queries (look for high Duration values)
- Queries missing proper indexes
- Runaway queries locking tables or consuming excessive resources
Using Snapshots to Troubleshoot
Section titled “Using Snapshots to Troubleshoot”- Start with HTTP Queries — Look for patterns. Is a single URL appearing repeatedly, or is a request taking an unusually long time? That is likely the source of the problem.
- Review the Process list — Check which processes were using the most CPU and memory. The CMD column shows the script path, which tells you exactly what was running.
- Examine Database Queries — If slow queries appear, consider adding indexes or optimizing the queries shown in the snapshot.
Common Causes Revealed by Snapshots
Section titled “Common Causes Revealed by Snapshots”| What You See | Likely Cause | Suggested Fix |
|---|---|---|
Repeated requests to wp-cron.php | WordPress cron running too frequently | Disable WP-Cron and use a real cron job |
| Many requests from bots/crawlers | Aggressive bot traffic | Block bots via .htaccess |
Long-running lsphp processes | Unoptimized scripts or plugins | Review and optimize the identified scripts or plugins |
Slow SELECT queries on large tables | Missing database indexes | Add indexes to the columns used in WHERE and JOIN clauses |
| Multiple simultaneous cron jobs | Overlapping cron schedules | Stagger cron job timing or reduce frequency |
Requests to wp-load.php with long duration | Heavy WordPress AJAX or plugin activity | Identify the plugin making the request and optimize or replace it |